This table shows how procurement spend is distributed across host-community proximity zones, helping illustrate where supplier value is captured — from near‑mine communities through to national suppliers. This table is linked to MMG’s Local and regional development material topic KPI on in‑country procurement spend distribution across near‑mine/district, provincial/state and national levels.
Rotate your device for the best view
Last updated on 16 April 2026 at 10:15am, Hong Kong time (HKT)
| Site | Near-mine / district level (Zone 1) | % (Zone 1) | Provincial / State level (Zone 2) | % (Zone 2) | National level (Zone 3) | % (Zone 3) | Total Spend |
|---|---|---|---|---|---|---|---|
| Dugald River | 18779.75 | 5.51% | 178633.09 | 52.40% | 323363.23 | 94.85% | 340927.53 |
| Exploration | 3185.14 | 18.70% | 3231.17 | 18.97% | 15412.32 | 90.48% | 17033.72 |
| Head Office | 13313.80 | 17.39% | 15763.70 | 20.59% | 57263.09 | 74.80% | 76549.88 |
| Khoemacau | 109872.91 | 26.49% | 116001.80 | 27.97% | 346524.80 | 83.54% | 414790.78 |
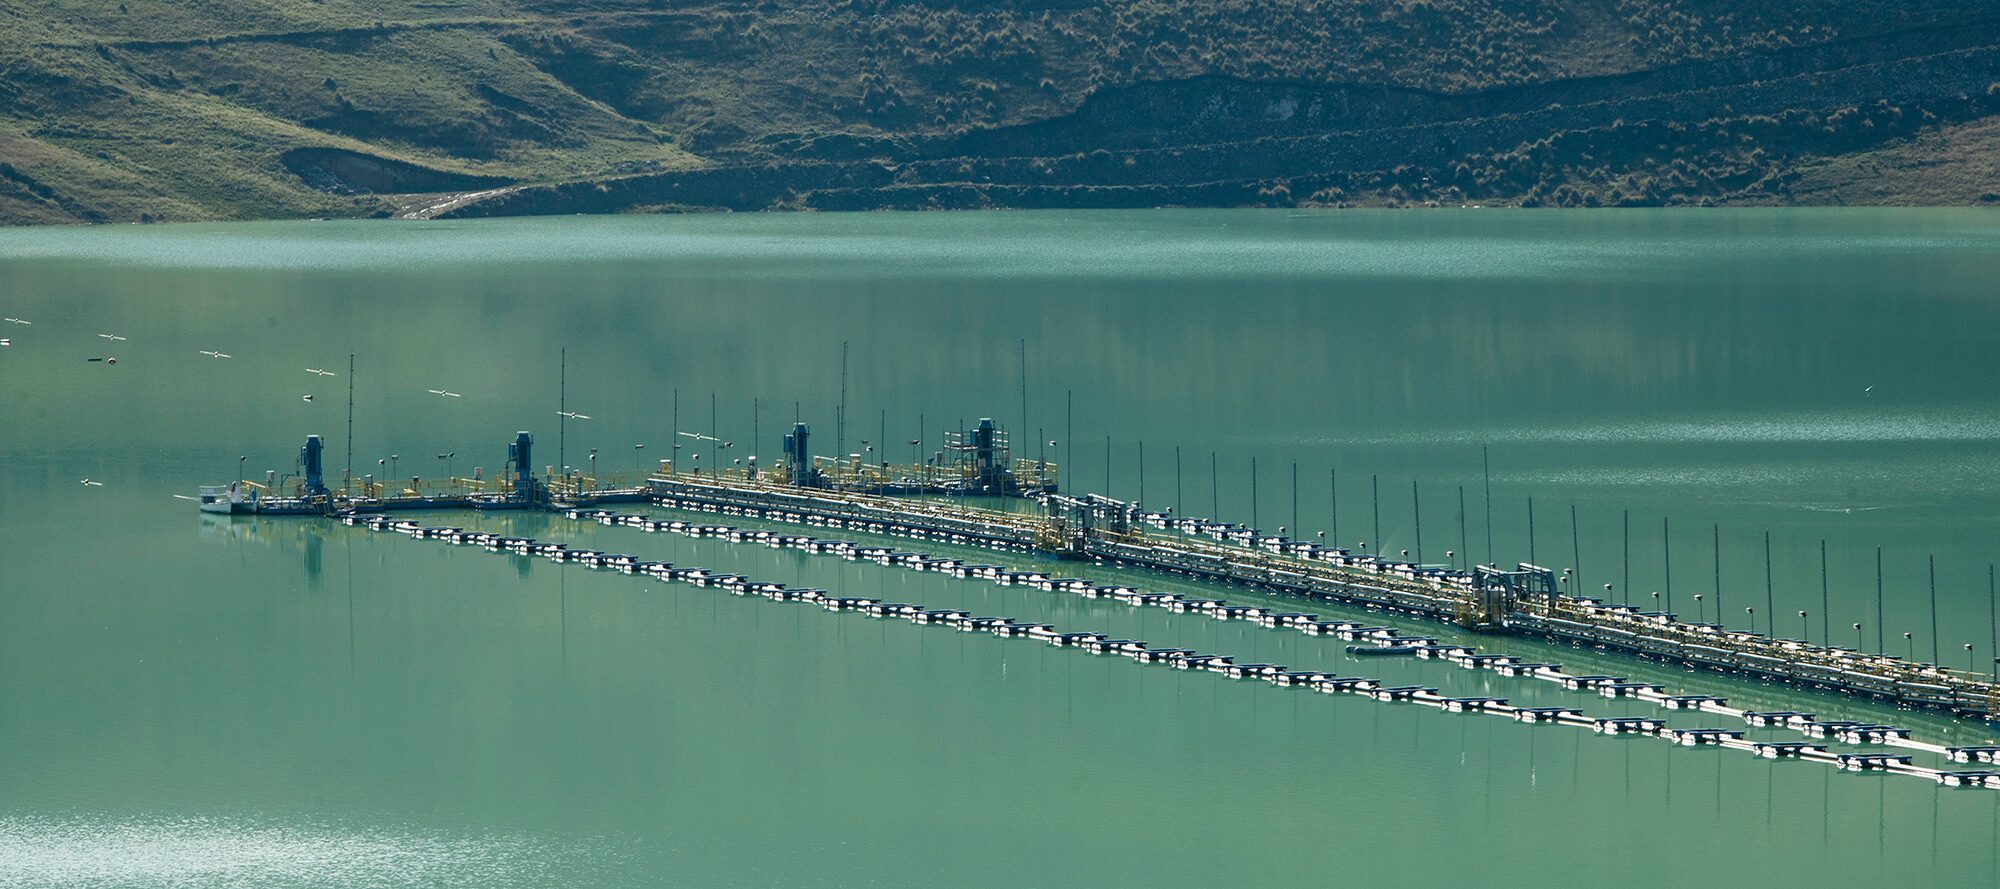
| Kinsevere | 273482.21 | 65.11% | 300842.54 | 71.63% | 316138.18 | 75.27% | 420018.27 |
| Rosebery | 18015.09 | 9.96% | 88080.01 | 48.71% | 179730.51 | 99.39% | 180834.71 |
| Las Bambas | 188326.25 | 10.12% | 224695.44 | 12.07% | 1509329.57 | 81.07% | 1861741.01 |
-
Procurement spend: Total value of goods and services procured from suppliers, reported in USD and attributed to the site/operational unit where used or delivered.
-
Zone definitions:
- Zone 1 – Near‑mine / District level: suppliers in local townships/districts/municipalities surrounding the site.
- Zone 2 – Provincial / State level: suppliers registered in the same province/state as the operation.
- Zone 3 – National level: suppliers located within the host country outside Zones 1 and 2.
-
Total spend: Zone 1 + Zone 2 + Zone 3 = Total spend (per site).
-
Percentages: % in Zone = (Zone spend ÷ Total spend for site) × 100.